

Our Approach
Our work is structured around three connected stages that continuously inform one another — from understanding context to building and maintaining what is put in place. This end-to-end approach ensures continuity from initial decisions through to ongoing use.
1 Exploration & Ideation
For the curious businesses who are unsure where to start – we kickstart the process by exploring the possibilities of your data based on your individual needs.
We take the time to truly understand your business’ goals and challenges, while also investigating the trends and opportunities related to use of data and AI in your industry. Combining technical expertise with business understanding, we ideate solutions that are both technically sound and strategically focused.
In this process, we dive deep into your data to ensure the defined solutions are feasible and create sustainable value for your business.
2 Development
Once the desired solution is defined, we move on to its technical development, working iteratively and keeping you in the loop at every step.
Using our technical expertise, we design and build all necessary pipelines – from data collection and prototyping to model development and testing. We are flexible with the tools and technologies we use, ensuring that the solution is tailored to your specific requirements and existing systems. For us, the focus is on building a robust and secure architecture, that scales well with future growth.
Throughout this phase, we emphasise transparency and collaboration, providing regular updates and incorporating feedback to ensure the solution evolves in line with your needs.
3 Implementation & Maintenance
In the final phase, we ensure a smooth implementation of the solution, seamlessly integrating it into your workflow and preferred environment.
We stay with you beyond the finish line — this process includes monitoring and maintaining the solution to ensure it keeps running efficiently. Ongoing support is always part of our commitment.
If further development is needed or new inspiration arises, we remain engaged, working in iterative cycles of the end-to-end process to adapt or create new solutions as your business evolves.


Data Engineering
Data engineering forms the foundation of how data can be used across an organisation. We design and build the underlying infrastructure that brings data together across systems, structures it consistently, and ensures it can be accessed and used reliably.
Our work typically includes developing data pipelines, modelling data structures, and establishing platforms where information can be stored, maintained and prepared for analysis and downstream use.


Data Engineering
Use Case: A Unified Data Platform
An example of how fragmented data can be brought together into a structured and consistent foundation, making it easier to access, maintain and use in practice.
Read more
Fragmented data across spreadsheets, systems and databases often leads to inconsistencies and a lack of shared understanding. This makes it difficult to trust data and use it consistently across the organisation.
A unified data platform brings data together into a single, structured foundation where information is aligned, maintained and made available for use across teams and systems
What this enables
-
Single foundation: A shared and consistent view of data across systems
-
Reliable reporting: Access to up-to-date data without manual consolidation
-
Scalability: A structure that can grow with increasing data volumes and use cases
Data Analysis
Data analysis focuses on understanding what your data shows and how it can inform decisions. We work with existing data to identify patterns, surface insights and create a clearer picture of performance and behaviour.
This includes structuring and exploring datasets, developing analytical models, and translating findings into insights that can be used in day-to-day work and decision-making.


Data Analysis
Use Case: Hidden Revenue Opportunities
An example of how existing data can be analysed and structured to uncover patterns, understand performance and create a clearer basis for decisions in practice.
Read more
Data is often available but not fully understood. Without structure and analysis, patterns remain hidden and decisions rely on incomplete or fragmented views.
Through analysis, data can be explored and organised to reveal how performance develops over time and how different parts of the business relate to each other. This creates a clearer and more shared understanding across teams.
What this enables
-
Performance visibility: A clearer understanding of what is working and where improvements can be made
-
Pattern recognition: Identification of trends and relationships across data
-
Informed decisions: A more reliable basis for decision-making in practice
Data Visualisation
Data visualisation makes data accessible and understandable across an organisation. We design interfaces that present information clearly, helping teams navigate data, monitor performance, and share a common understanding.
Our work includes building dashboards and visual tools that organise complex information, making it easier to interpret and use in practice.


Data Visualisation
Use Case: Automated Reporting
An example of how data can be presented in a structured and accessible way, creating a shared understanding of performance across teams.
Read more
Data is often available but not easily accessible in a usable form. When reporting relies on manual preparation or disconnected views, it becomes difficult to maintain a consistent understanding across the organisation.
With a structured dashboard setup, data can be presented in a clear and continuous way. This makes it easier to follow performance, share insights and use data as a reliable part of everyday work.
What this enables
-
Shared understanding: A consistent view of key metrics across teams and functions
-
Ongoing visibility: A continuous and up-to-date view of performance
-
Ease of use: Data that is easier to navigate and work with in practice
-
Reduced overhead: Less time spent preparing and maintaining reports
Machine Learning
Machine learning extends how data can be used by identifying patterns and enabling more advanced forms of automation and prediction. We develop models that learn from data and support more efficient and scalable ways of working.
This typically involves training and deploying models for tasks such as classification, prediction and anomaly detection, and integrating them into existing systems and workflows


Machine Learning
Use Case: Identifying Valuable Customers
An example of how customer data can be used to understand patterns in behaviour and identify which customers are likely to create long-term value.
Read more
Customer data typically contains signals about behaviour, engagement and value, but these are not always captured through simple analysis.
Machine learning models can be applied to identify and quantify these patterns, using historical data to estimate future value and understand how different customer groups develop over time.
This creates a more structured basis for prioritisation, communication and allocation of resources.
What this enables
-
Customer value estimation: Quantify expected long-term value based on observed behaviour and historical patterns
-
Segmentation: Group customers based on behaviour and predicted value to support more structured targeting
-
Churn detection: Identify changes in behaviour that indicate increased risk and enable earlier response
Predictive Modelling
Predictive modelling focuses on anticipating future developments based on historical data. We apply statistical and machine learning methods to forecast trends, identify risks and support planning.
Our work includes building models that provide forward-looking insights, helping organisations make more informed decisions and prepare for what lies ahead

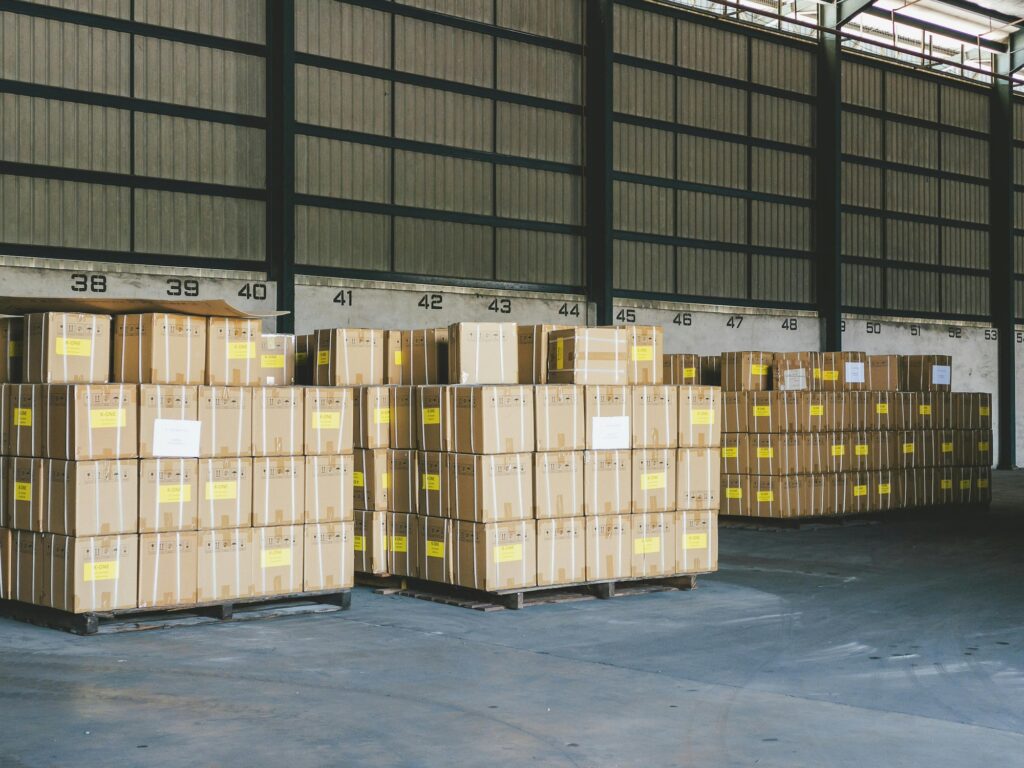
Predictive Modelling
Use Case: Automated Sales Prediction
An example of how historical data can be used to generate consistent forecasts of demand and sales, supporting planning and inventory decisions over time.
Read more
Sales forecasting and inventory planning often rely on manual processes or static assumptions. This makes it difficult to maintain consistency and adapt to changing patterns over time.
By applying predictive models to historical data, patterns in demand and behaviour can be identified and used to generate more reliable forecasts. This allows forecasting to become a continuous and structured process rather than a recurring manual task.
What this enables
-
Forecasting consistency: A more stable and repeatable approach to demand and sales forecasting
-
Reduced manual effort: Less time spent on manual forecasting and data preparation
-
Scalable forecasting: The ability to handle increasing data volumes without added operational complexity
Workshops
Our workshops are designed to build a practical understanding of AI within your organisation. We focus on how tools like ChatGPT can be applied in everyday work in a way that is clear, relevant, and immediately usable.
GenAI for the Workplace – Practical Skills for Your Team
Our sessions are shaped around your context and typically combine introductions, demonstrations and hands-on experience.
What is covered
- Core concepts and practical use of AI tools
- Real-world applications in everyday work
- Hands-on experience with selected use cases
-
Considerations around responsible and effective use
Choose the format that works for you
-
Day workshop (7h): Interactive, hands-on, and packed with practical with insights and use cases across numerous areas.
-
Half-day workshop (3.5h): Focused, semi-interactive sessions with selected use cases.
-
Talk (1.5–2h): A dynamic, demonstration-style introduction with homework to try later.

Ready to Explore Your Data More Closely?
We are always open for a conversation and would
love to get a glimpse into your world.
Book a free initial meeting using the
calendar form, or contact us directly below.